Small teams don’t have time to waste. Resources are tight, priorities compete, and the idea of “data-driven decisions” often sounds great, until you’re knee-deep in dashboards and spreadsheets with no clear next step.
I’ve seen it firsthand. Numbers get collected because we’re supposed to collect them. Reports are built because someone requests them. But what’s often missing is the bridge between data and action.
How do we transition from tracking metrics to effectively using them to run the business more efficiently?
That’s what this article is about. It’s not a lecture on advanced analytics (I’ll leave that to the data scientists). It’s a playbook for small teams in real businesses to make data useful and keep it moving.
Why Small Teams Need a Data Framework (More Than Big Ones)
Here’s the irony: big companies have armies of analysts, but it’s the smaller teams, where one good decision can swing the quarter, that most need real-time insight and focus.
But too often, data efforts in SMBs get stuck:
- Drowning in metrics but lacking meaning.
- Overwhelmed by dashboards that aren’t actionable.
- Running operations by gut… even when better signals exist.
The key isn’t more data. It’s structured thinking around what matters and how to use it.
Here’s the simple framework I use with clients and teams to bring data to life in daily operations.
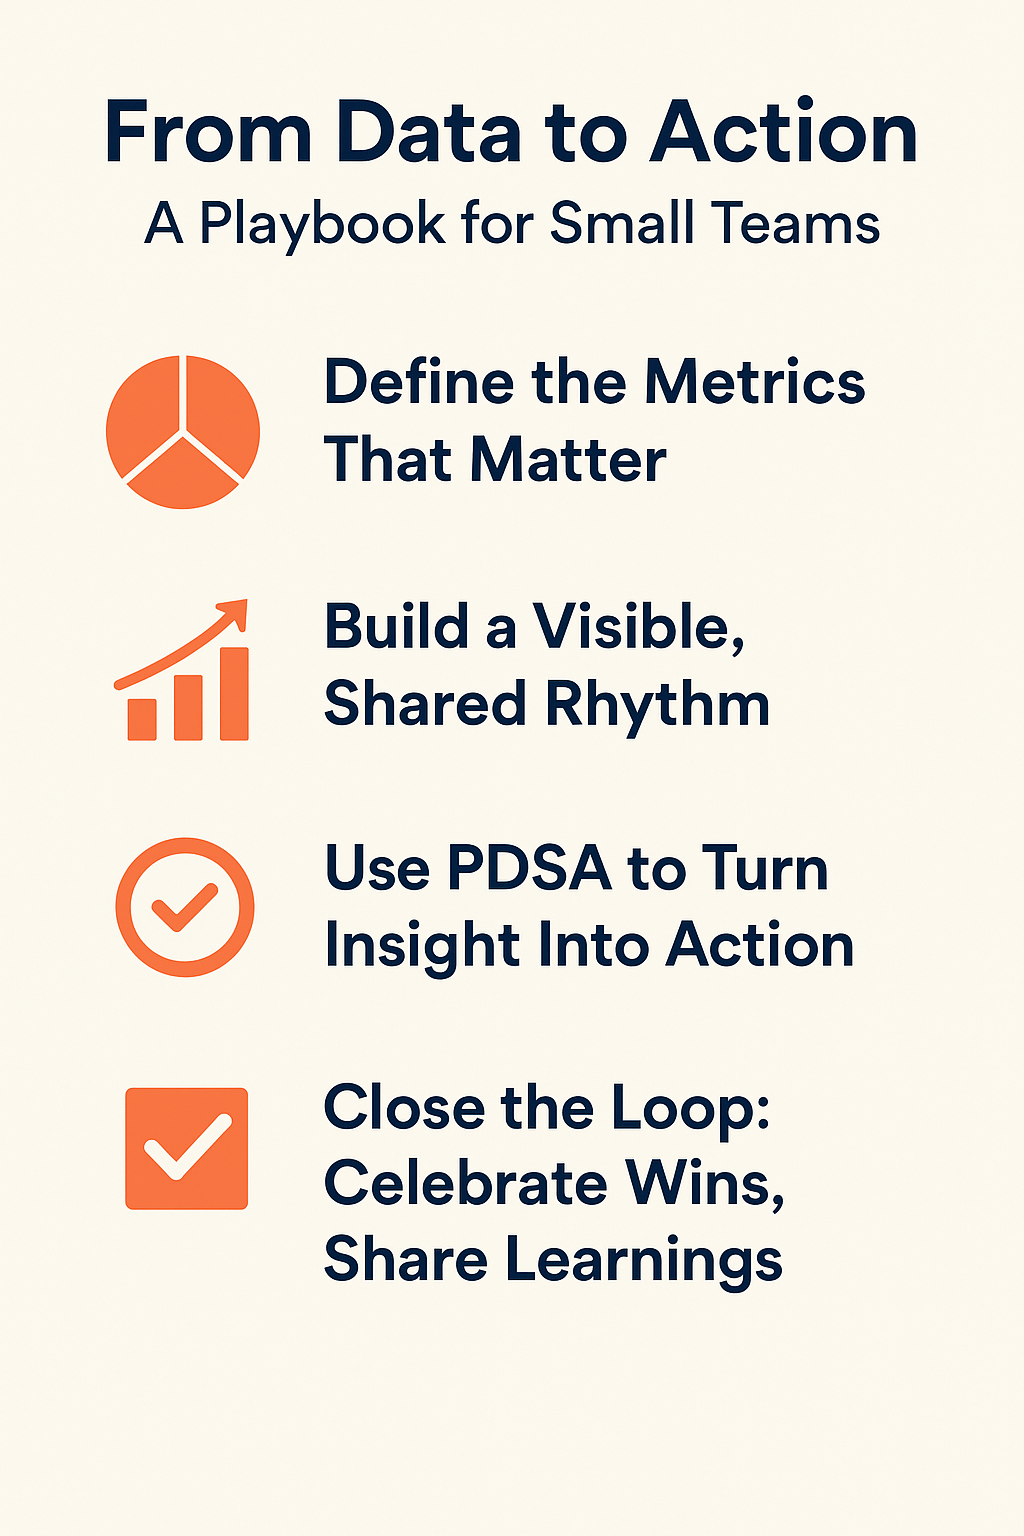
The 5-Step Playbook: From Data to Action
1. Define the Few Metrics That Matter
First things first: simplify.
Ask yourself: What are the 3–5 metrics that truly tell us how the business is doing? Not 30. Not 15. Just the vital few.
In manufacturing, that might be:
- On-Time Delivery
- First-Pass Yield
- Labour Hours per Unit
In a clinic or service environment:
- Appointment Lead Time
- Patient/Customer Satisfaction
- Billable Utilization
Pick KPIs that tie clearly to your goals: revenue, customer outcomes, cost, and quality. If a number doesn’t drive decisions, question why it’s being tracked.
📌 Tip: Metrics should be like headlights, not rearview mirrors. They should help you steer, not just look back.
2. Build a Visible, Shared Rhythm
Once you have the right metrics, you need a consistent review cadence.
Data should never live in a lonely spreadsheet or a dusty dashboard. It should be visible. Reviewed regularly and tied to the rituals of how you run the business.
- Weekly team huddle? Look at KPIs.
- Monthly operations review? Trend the data.
- Daily standup? Track leading indicators.
The point isn’t to talk about numbers for the sake of it. The point is to create shared awareness and momentum.
📌 Tip: Use charts, not tables. Make it visual. Red/green works (I’ll always say yellow is meaningless). Directional arrows work. Don’t let formatting be the reason people tune out.
3. Use PDSA to Turn Insight Into Action
Seeing the number is not the goal. Doing something with it is.
This is where PDSA, Plan, Do, Study, Adjust, comes in. It’s the bridge between data and continuous improvement.
You don’t need big “kaizen events” or massive overhauls. Small, regular PDSA cycles, driven by what the data reveals, can have a significant cumulative impact.
📌 Tip: Log your PDSAs in a shared place (even a whiteboard or Notion doc). Visibility builds momentum.
4. Close the Loop: Celebrate Wins, Share Learnings
In small teams, culture is everything. Data alone won’t change behaviour, but stories will.
- Did a change cut rework by 20%?
- Did a new scheduling approach improve customer feedback?
- Did someone raise a red flag that led to a fix?
Celebrate that. Share the outcome. Give credit.
This is how you build a culture where people don’t just track metrics, they own them.
📌 Tip: If no one hears what the data led to, they’ll stop caring about the data.
5. Evolve – Don’t Freeze – Your Metrics
Lastly, remember this: your metrics should evolve.
As your business grows, goals change. Processes mature. Market conditions shift. Your data framework should adapt accordingly.
Every 12 months, pause and ask:
- Are these metrics still the best indicators?
- What’s no longer relevant?
- Is there something we should add?
Don’t let inertia drive your dashboard. Let intentionality do it.
📌 Tip: A dead metric is worse than no metric; it confuses the signal.
What This Looks Like in Practice
A client I worked with, a 25-person team in a service business, was tracking dozens of numbers weekly. Their leadership meetings were a blur of spreadsheets and gut feel.
We simplified and chose four key KPIs:
- Weekly Sales Pipeline
- Customer NPS (more often reviewed biweekly/monthly)
- Time to Fulfillment
- Utilization %
We built a basic scorecard. We assigned owners. We tied the review to their Monday huddle. Most importantly, we asked one simple question every week:
👉 What do we want to try based on this data?
Three months in, things shifted:
- NPS climbed because fulfillment lead times dropped.
- The sales team focused on better-fit leads, not just volume.
- Operations got ahead of problems instead of reacting late.
No extra headcount. No fancy tools. Just structure, rhythm, and mindset.
Final Thought: Clarity Beats Complexity
In my experience, SMBs don’t lack ambition. They lack time. And time is what gets wasted when teams collect data without direction or debate about its meaning, with no shared playbook.
The good news? You don’t need to be perfect. You just need to be consistent.
That’s how small teams turn data into momentum. That’s how you build clarity in motion.
Because in the end, good operations aren’t just about knowing what’s going on. They’re about doing something about it, every day, a little bit better.
